

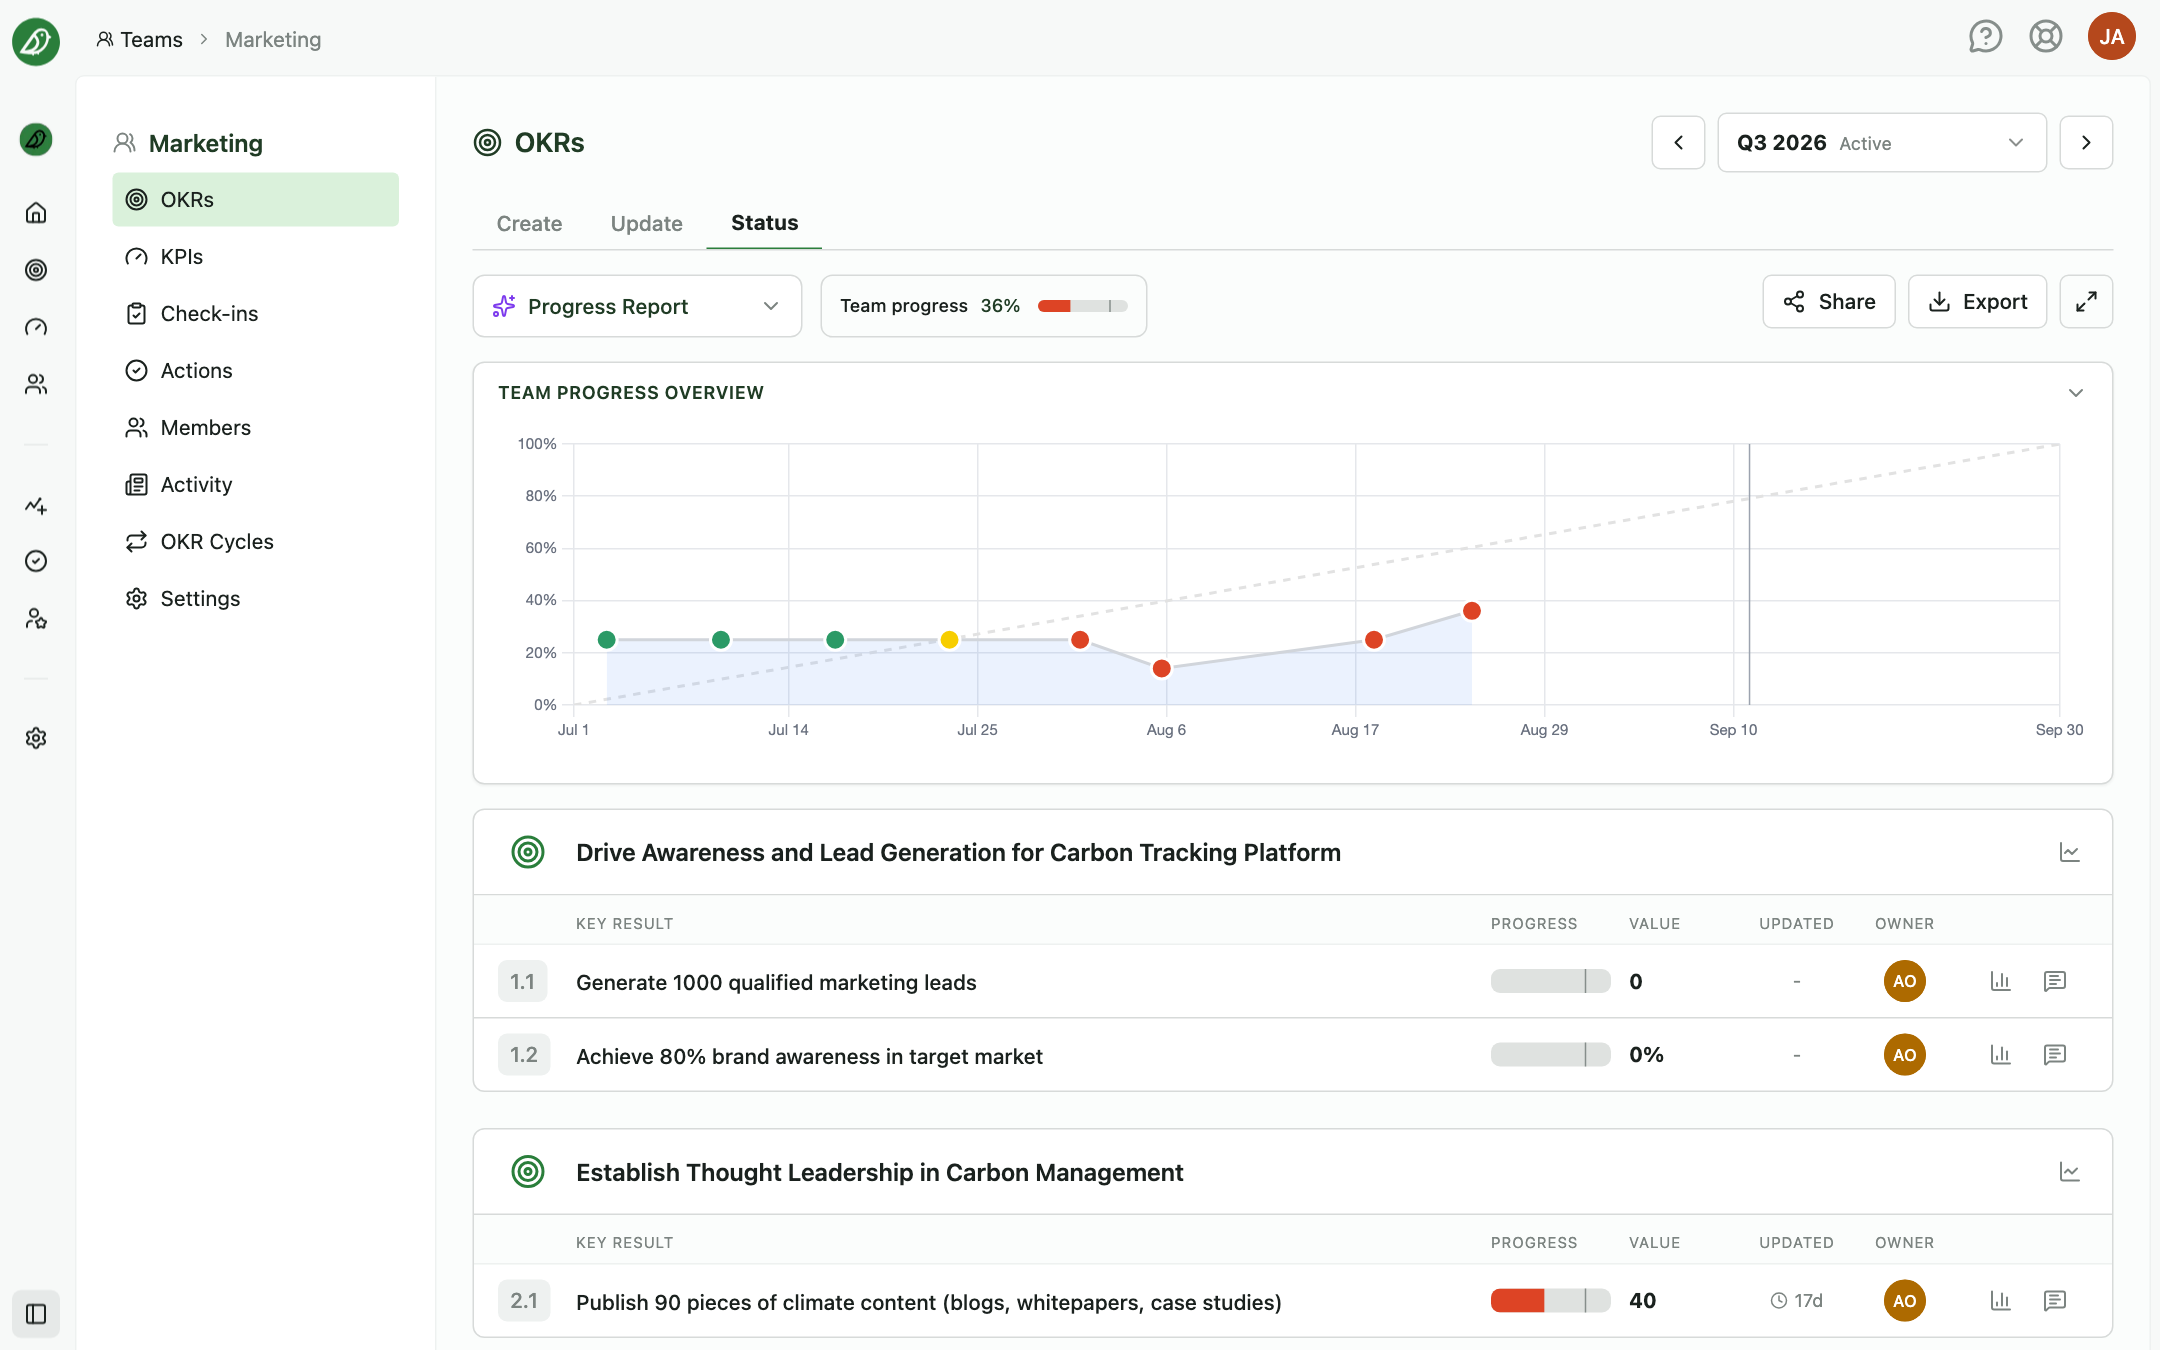
The Status tab in a team's OKRs section gives you a read-only overview of every key result in the selected cycle. It shows each key result's progress bar, traffic light, current value, last updated date, and owner at a glance.
Traffic light statuses
Every key result carries one of four traffic lights:
- Not started (grey): No progress has been recorded yet
- On track (green): Progress is on pace to meet the target by the end of the cycle
- Behind (yellow): Progress is lagging and the key result may miss its target without corrective action
- Critical (red): The key result is significantly off pace and needs immediate attention
Automatic lights
By default OKRnest computes the light from the key result's pace: the progress made so far compared with the progress expected at this point in the cycle. The expected line is straight from the start to the end of the cycle, or follows the key result's milestones when they are set. Your organisation's Status colour thresholds (see below) decide where On track ends and Behind and Critical begin.
At the very start of a cycle, zero progress counts as Not started rather than Critical. This grace period lasts for the first 10% of the cycle, up to 30 days.
Manual overrides
When the Key result status feature is enabled under Admin Settings > Features, the person recording an update can override the automatic light using the Traffic light / outlook field in the update dialog. The override stays in place until someone chooses Auto again. Status views show the resolved light either way, so an owner's judgement and the numbers-based assessment use the same colours.
Team progress
At the top of the Status tab a Team progress bar shows overall progress across all key results. The percentage is a weighted average where key results with higher weights contribute more to the total (with the OKR weights feature), and key results excluded from progress calculations do not count.
With the AI Assistant enabled, a Progress Report card next to it can generate a written summary of the team's progress.
The Team Progress Overview card below plots progress over time against the expected pace. Its display settings let you Group chart updates by a different period than the team's cadence.
What each key result row shows
Key results are listed under their objective with the columns Key Result, Progress, Status, Value, Updated, and Owner:
- Key Result: The number (e.g. 1.1) and title, plus a badge when the key result is completed or abandoned
- Progress: A bar comparing current progress against the target, with a marker showing how much cycle time has passed
- Status: The traffic light as a coloured pill
- Value: The current value against the target
- Updated: How recently the key result was updated
- Owner: The assigned owner's avatar
Exploring key result details
Each row has two toggles: View history shows an inline progress graph and table of all updates over time, and View comments lists past updates with their values, statuses, dates, and comments.
Click the key result's title to open its status sheet, with tabs:
- Status: A progress chart, the current value and status, and the full list of updates. If you have permission, you can edit or delete individual updates here
- Actions: Actions linked to this key result (when the Actions feature is enabled)
- Supporting Key Results: Key results from child teams that support this one
- Edit: The key result's settings
Share, export, and fullscreen
Buttons at the top right of the Status tab (desktop only):
- Share creates a public link to this status view for people without an OKRnest account. Requires the Shareable views feature; see below
- Export downloads the cycle as an Excel file or PowerPoint deck; see Exporting OKRs
- Enter fullscreen fills the screen with the status view, including the team name, cycle label, and team progress in a sticky header. Useful for team reviews or projecting the board in meetings. Press Escape or click Exit fullscreen to leave
Sharing a status view
Share status view creates a link that shows this team's status without logging in. Choose What to show: Latest active cycle (the link always shows the team's current cycle) or a specific cycle. Give the link a Name, optionally protect it with a Secret that viewers must enter, and optionally set an Expiry date. Click Create link.
Existing links are listed in the same dialog, where you can copy the link or its secret, open it, edit it, Reset link to invalidate the old address, or Delete link. Admins see every shared link in the organisation under Admin Settings > Security > Shared view links.
Status colour thresholds
Admins configure the thresholds under Admin Settings > OKR Settings. The Status colour thresholds slider sets two percentages of expected progress: at or above the upper value is On track (default 100%), between the two values is Behind (default 80 to 100%), and below the lower value is Critical. The same thresholds colour aggregated progress on the organisation-wide OKRs page, in exports, and on key results whose light is set to Auto.
Tips for using the Status tab
- Review status regularly: Use the Status tab during team syncs to spot key results that need attention
- Use fullscreen for meetings: The fullscreen view keeps the focus on progress without sidebar distractions
- Share instead of screenshotting: A shared view stays current and can be protected with a secret
- Compare progress to time: The progress bar's cycle marker shows whether a key result is ahead of or behind the expected pace